> For the complete documentation index, see [llms.txt](https://docs.plura.io/ko/llms.txt). Markdown versions of documentation pages are available by appending `.md` to page URLs; this page is available as [Markdown](https://docs.plura.io/ko/fn/comm/fdetection/net.md).

# 네트워크

{% hint style="info" %}
정보보안 제품 및 네트워크 장비에서 발생하는 로그를 수집하여 이상 징후를 탐지합니다.

각 장비에서 외부 syslog를 설정하면, PLURA Log Collector(PLC)가 로그를 수집하여 제공합니다.
{% endhint %}

### 1. 로그 상세 내용

* **분석정보 탭**: 해시 이전의 로그를 볼 수 있는 기능을 제공합니다.

<figure><img src="/files/cbnvWLLi985RCKvjECHu" alt=""><figcaption></figcaption></figure>

### 2. 로그상세 원본로그 내용

* **로그 상세 탭**: 수집된 원본 로그를 JSON 형식으로 가공하여 제공합니다.

<figure><img src="/files/d95CjVVpiYXkPetIFmJ0" alt=""><figcaption></figcaption></figure>

### 3. 전체 로그 이동 (우클릭 옵션)&#x20;

* 로그 컬럼에서 마우스 우클릭을 통해 전체 로그 페이지로 편리하게 이동할 수 있습니다.
* 티켓 발행, IP주소 태그 입력, 시스템 관리 페이지로 이동<br>

  <table><thead><tr><th width="202">선택 조건</th><th>의미</th></tr></thead><tbody><tr><td>전체로그(=) </td><td> '동일' 시간대의 전체로그</td></tr><tr><td>전체로그(±1s)</td><td>'1초' 전후 시간대의 전체로그</td></tr><tr><td>전체로그(±2s)</td><td>'2초' 전후 시간대의 전체로그</td></tr><tr><td>전체로그(±3s) </td><td>'3초' 전후 시간대의 전체로그</td></tr><tr><td>전체로그(±5s) </td><td>'5초' 전후 시간대의 전체로그</td></tr><tr><td>전체로그(±10s) </td><td>'10초' 전후 시간대의 전체로그</td></tr><tr><td>전체로그(±30s) </td><td>'30초' 전후 시간대의 전체로그</td></tr><tr><td>전체로그(±60s) </td><td>'60초' 전후 시간대의 전체로그</td></tr></tbody></table>

***

### 4. 정렬

* **정렬 기준**: 생성일 기준으로 최신순 또는 과거순으로 정렬할 수 있습니다.&#x20;
* 기본 정렬은 최신순으로 설정되어, 가장 최근에 생성된 로그가 먼저 표시됩니다.

<figure><img src="https://qubitsec.github.io/docs/images/Manual/common/filter/network/1.png" alt="" width="563"><figcaption></figcaption></figure>

### 5. 페이지당 로그 라인 수 설정

* 한 페이지에 표시되는 로그 라인 수를 20 \~ 100 라인 사이에서 설정할 수 있습니다.<br>

  <figure><img src="https://qubitsec.github.io/docs/images/Manual/common/filter/network/2.png" alt="" width="563"><figcaption></figcaption></figure>

### 6. 날짜/시간 선택

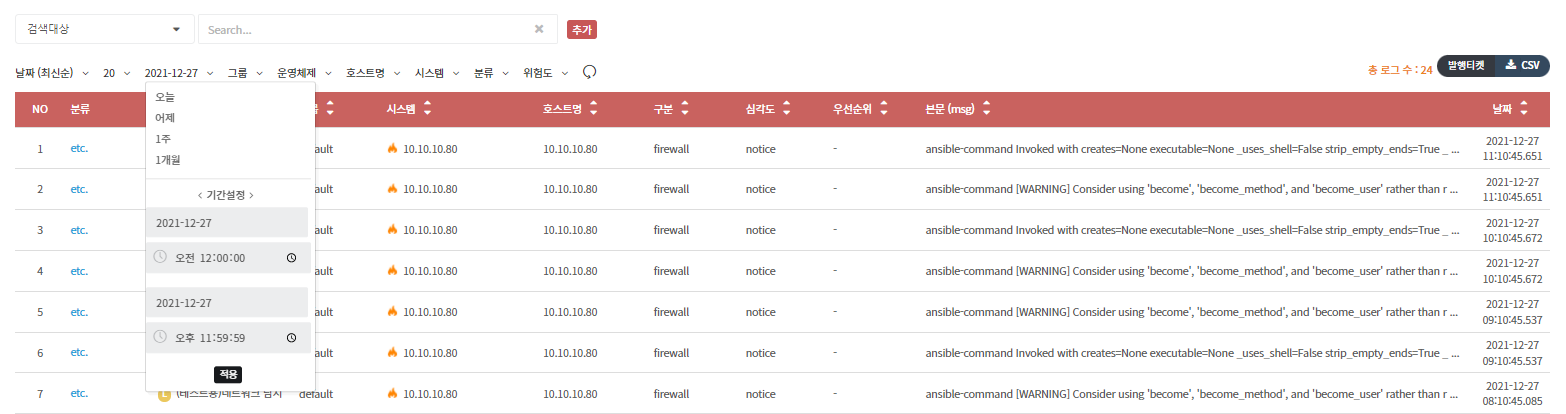
* 기본적으로 당일 발생한 로그를 표시하며, 시간 설정을 통해 특정 로그를 검색할 수 있습니다.&#x20;
* 전날, 1주일, 1개월 등 과거 기간도 선택 가능합니다.

<figure><img src="https://qubitsec.github.io/docs/images/Manual/common/filter/network/3.png" alt="" width="563"><figcaption></figcaption></figure>

### 7. 그룹 선택

* 그룹별로 로그를 정렬할 수 있습니다.<br>

  <figure><img src="/files/SDZtpkVqtz30xUU6nd62" alt="" width="563"><figcaption></figcaption></figure>

### 8. 운영체제 선택

* 운영체제별로 로그를 정렬할 수 있습니다.<br>

  <figure><img src="https://qubitsec.github.io/docs/images/Manual/common/filter/network/5.png" alt="" width="563"><figcaption></figcaption></figure>

### 9. 호스트명 선택

* 특정 호스트명을 선택하여 해당 호스트의 로그를 정렬할 수 있습니다.

<figure><img src="/files/x0PAhtZW8jGRhIXxdtig" alt="" width="563"><figcaption></figcaption></figure>

### 10. 호스트 선택

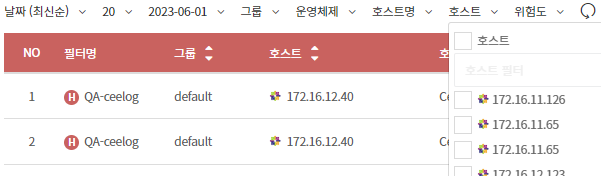
* 특정 호스트를 선택하여 해당 호스트의 로그를 정렬할 수 있습니다.<br>

  <figure><img src="https://qubitsec.github.io/docs/images/Manual/common/filter/network/6.png" alt="" width="563"><figcaption></figcaption></figure>

### 11. 분류 선택

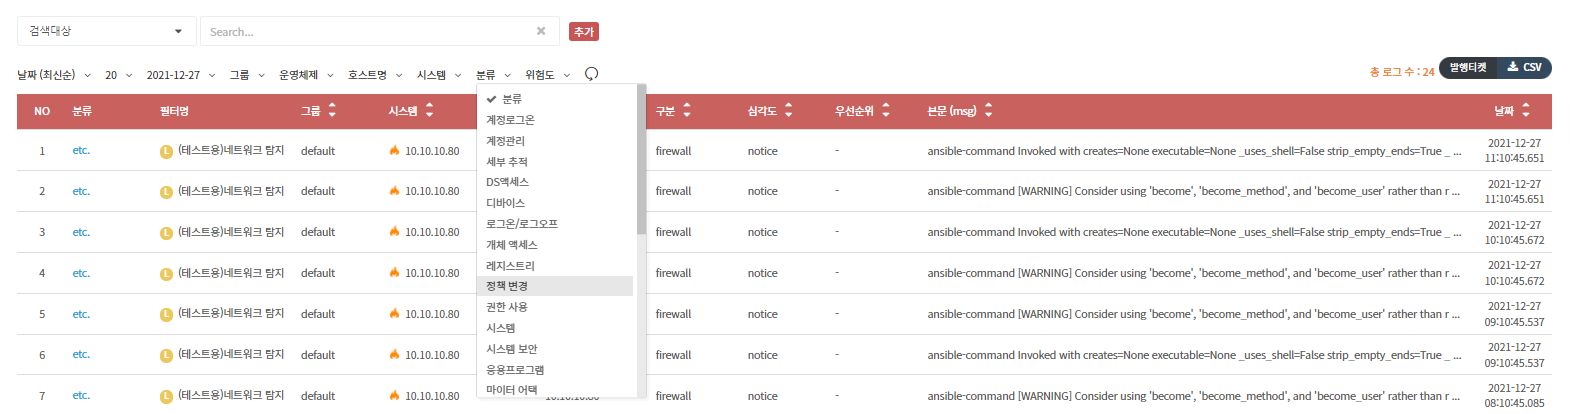
* 탐지 분류별로 로그를 정렬할 수 있습니다.<br>

  <figure><img src="https://qubitsec.github.io/docs/images/Manual/common/filter/network/7.png" alt="" width="563"><figcaption></figcaption></figure>

### 12. 위험도 선택

* 위험도에 따라 로그를 정렬할 수 있습니다.<br>

  <figure><img src="https://qubitsec.github.io/docs/images/Manual/common/filter/network/8.png" alt="" width="563"><figcaption></figcaption></figure>

### 13. 심각도 선택

* 심각도를 기준으로 로그를 정렬할 수 있습니다.

<figure><img src="/files/WXkBkIbRTYFgGviUrPFq" alt="" width="563"><figcaption></figcaption></figure>