> For the complete documentation index, see [llms.txt](https://docs.plura.io/ko/llms.txt). Markdown versions of documentation pages are available by appending `.md` to page URLs; this page is available as [Markdown](https://docs.plura.io/ko/fn/edr/flog.md).
# 전체로그
{% hint style="info" %}
**윈도우 및 리눅스 등 다양한 OS 호스트의 모든 이벤트 로그를 확인할 수 있습니다.**
[시스템관리](https://docs.plura.io/ko/function/common/system/management) > 호스트 정보에서 전체 로그 저장 여부를 설정할 수 있습니다.
{% endhint %}
### 1. 날짜 정렬
* **정렬 기준**: 생성일 기준으로 최신순 또는 과거순으로 정렬할 수 있습니다.
* 기본 설정은 최신순으로, 마지막으로 생성된 로그가 먼저 표시됩니다.
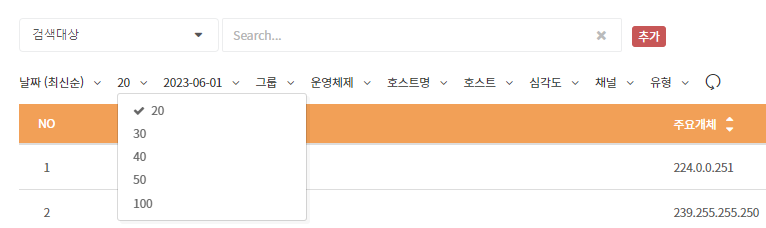
### 2. 페이지당 로그 라인 수 설정
* 한 페이지에 표시되는 로그 라인 수를 20 \~ 100 라인 사이에서 선택할 수 있습니다.
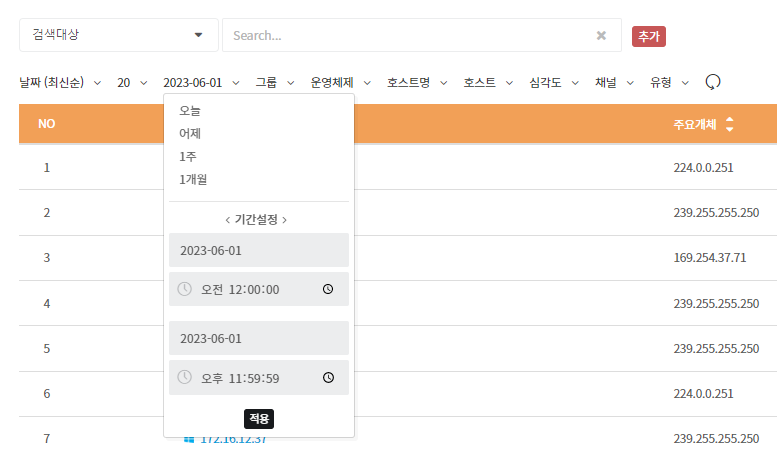
### 3. 날짜/시간 선택
* 기본적으로 당일 발생한 로그를 표시하며, 시간 설정을 통해 특정 로그를 검색할 수 있습니다.
* 전날, 1주일, 1개월 등 과거 기간을 선택할 수 있습니다.
### 4. 그룹 선택
* 그룹별로 로그를 정렬할 수 있습니다.
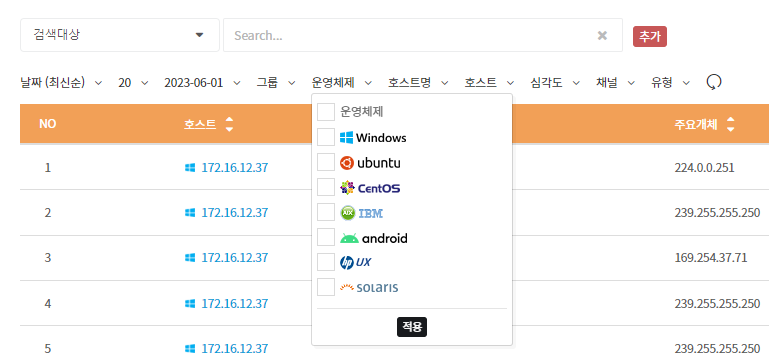
### 5. 운영체제 선택
* 운영체제별 로그 정렬이 가능합니다.
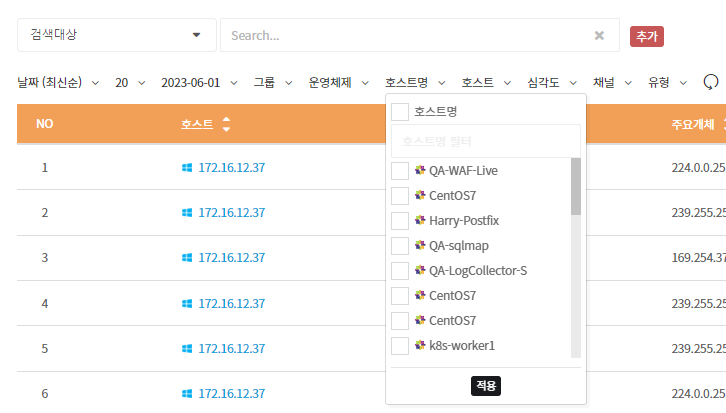
### 6. 호스트명 선택
* 특정 호스트명을 선택하여 해당 호스트의 로그를 정렬할 수 있습니다.
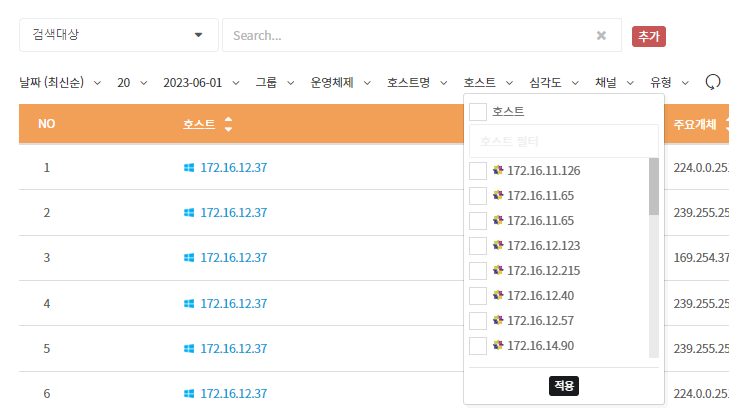
### 7. 호스트 선택
* 특정 호스트를 선택하여 해당 호스트의 로그를 정렬할 수 있습니다.
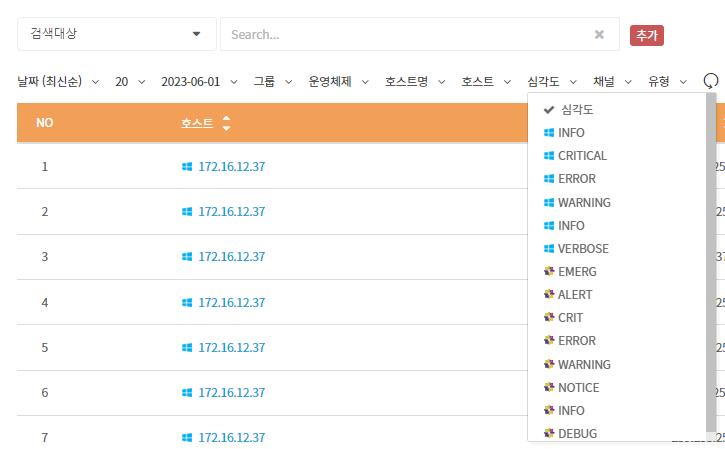
### 8. 심각도 선택
* 심각도에 따라 로그를 정렬할 수 있습니다.
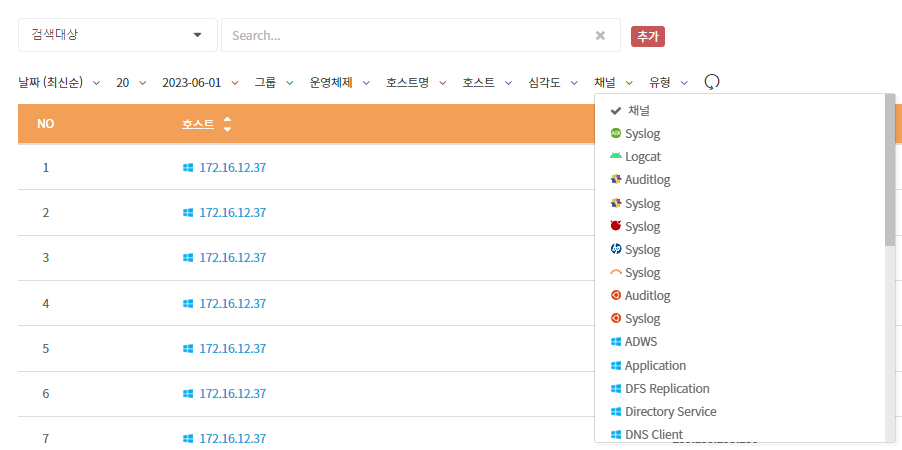
### 9. 채널 선택
* 로그 채널을 기준으로 로그를 정렬할 수 있습니다.
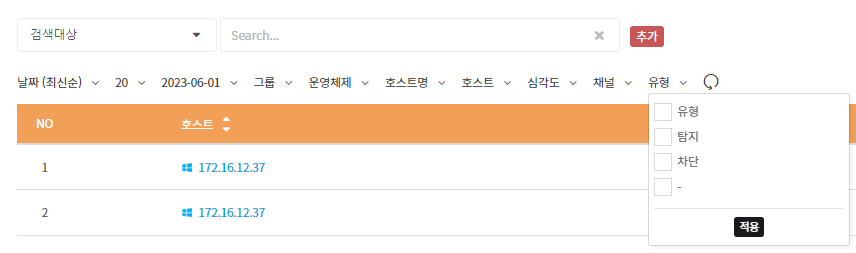
### 10. 유형 선택
* 유형별 선택을 하여 필요한 로그만 선택해서 확인할 수 있습니다.
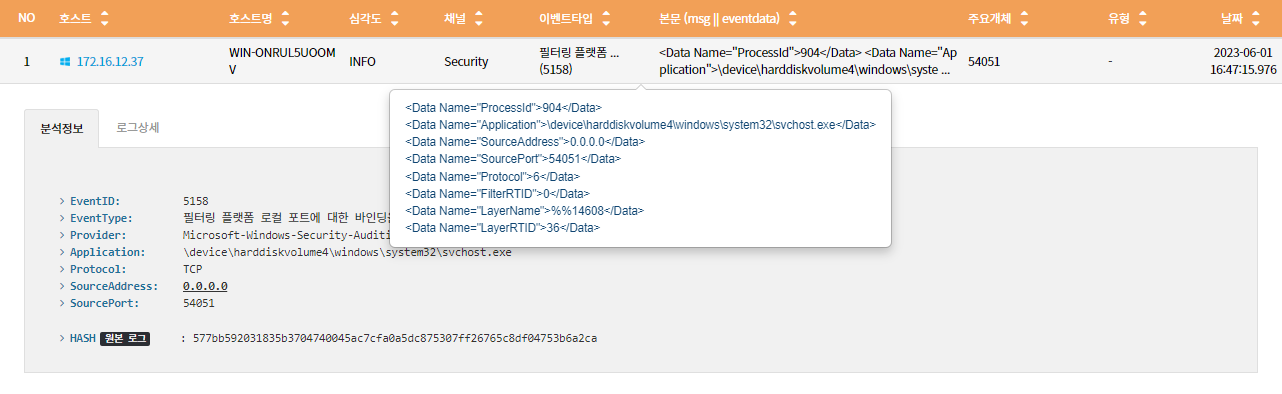
### 11. 로그 상세 내용
{% hint style="success" %}
컬럼명 설명
* 그룹: 시스템 > 그룹관리에서 설정된 호스트의 그룹
* 호스트명: 로그가 발생한 호스트의 hostname
* 심각도: 시스템이 분류하고 있는 해당로그의 심각도 종류
* 채널: 해당 로그가 발생한 채널
* 이벤트타입: 시스템이 분류하고 있는 해당로그의 이벤트타입
* 우선순위: 시스템이 분류하고 있는 해당 로그의 Priority
* 본문: 해당 로그의 msg 또는 eventdata 내용
* 유형: 차단 또는 탐지 필터 여부를 확인할 수 있는 PLURA 필터 분류
* 마이크로초: 해당 로그가 발생한 시간의 마이크로초
{% endhint %}
* OS별 모든 이벤트 로그를 제공합니다.
* 해시 이전의 로그를 확인할 수 있는 기능을 제공합니다.
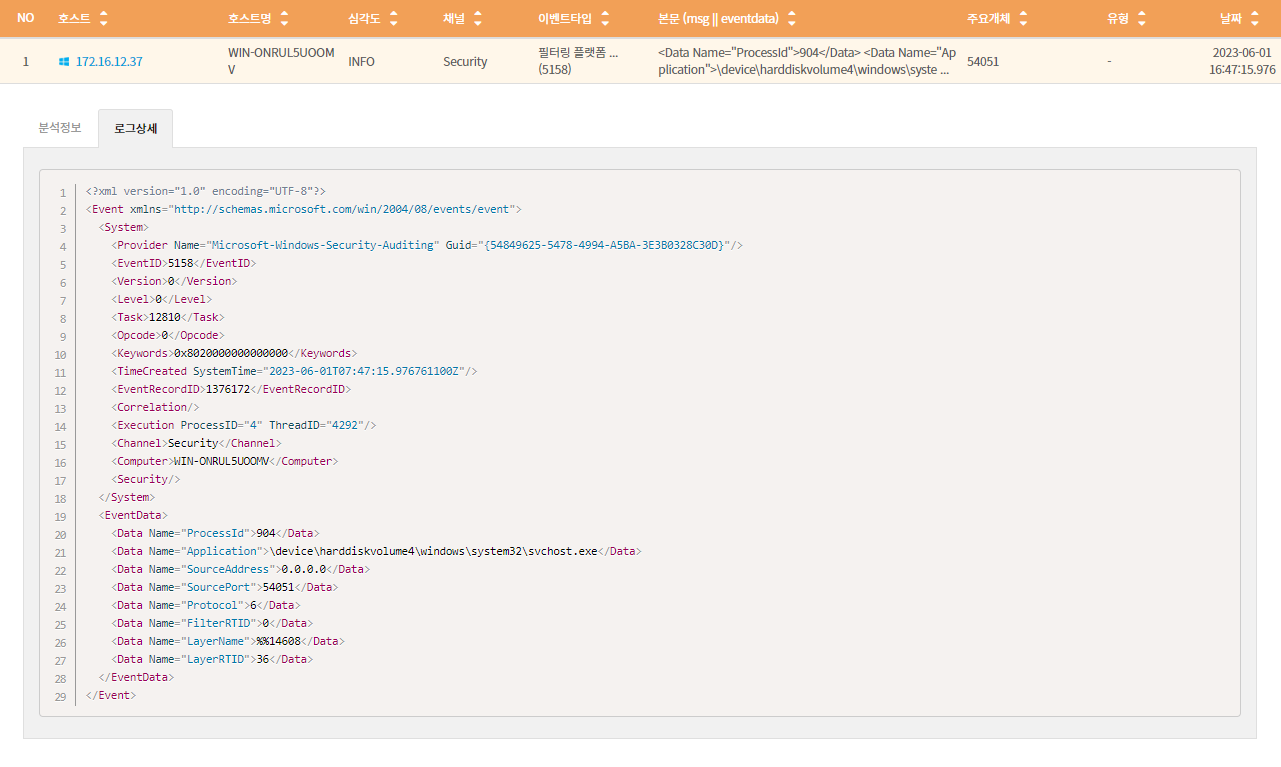
### 12. 로그상세 원본로그 내용
* **로그 상세 탭**: 수집된 원본 로그를 JSON 또는 XML 형식으로 가공하여 제공합니다.