# 필터탐지

{% hint style="info" %}
**계정 탈취 공격, 원격 접속 시도, 권한 상승, 측면 이동 공격 탐지 및 대응**

* 행위 기반 자동 공격 탐지 필터
* 사용자 정의 필터 제작 가능
* Windows 및 Linux 에이전트 제공
  {% endhint %}

### 1. 로그 상세 내용 <a href="#id-1" id="id-1"></a>

{% hint style="success" %}
컬럼명 설명

* 분류: 탐지된 필터 종류의 분류

* 그룹: 시스템 > 그룹관리에서 설정된 호스트의 그룹

* 호스트명: 로그가 발생한 호스트의 hostname

* 심각도: 시스템이 분류하고 있는 해당로그의 심각도 종류

* 채널: 해당 로그가 발생한 채널

* 이벤트타입: 시스템이 분류하고 있는 해당로그의 이벤트타입

* 우선순위: 시스템이 분류하고 있는 해당 로그의 Priority

* 본문: 해당 로그의 msg 또는 eventdata 내용

* 유형: 차단 또는 탐지 필터 여부를 확인할 수 있는 PLURA 필터 분류

* 마이크로초: 해당 로그가 발생한 시간의 마이크로초

* 티켓: 해당 로그의 티켓을 발행할 수 있는 버튼
  {% endhint %}

* 탐지된 로그를 클릭하면 각각의 로그에 담긴 자세한 내용을 확인할 수 있습니다.&#x20;

<figure><img src="/files/zu2D1VtZMR6M010an0jU" alt="" width="563"><figcaption></figcaption></figure>

* 수동차단 : 사용자가 탐지된 로그를 분석하여 직접 차단을 할 수 있습니다.
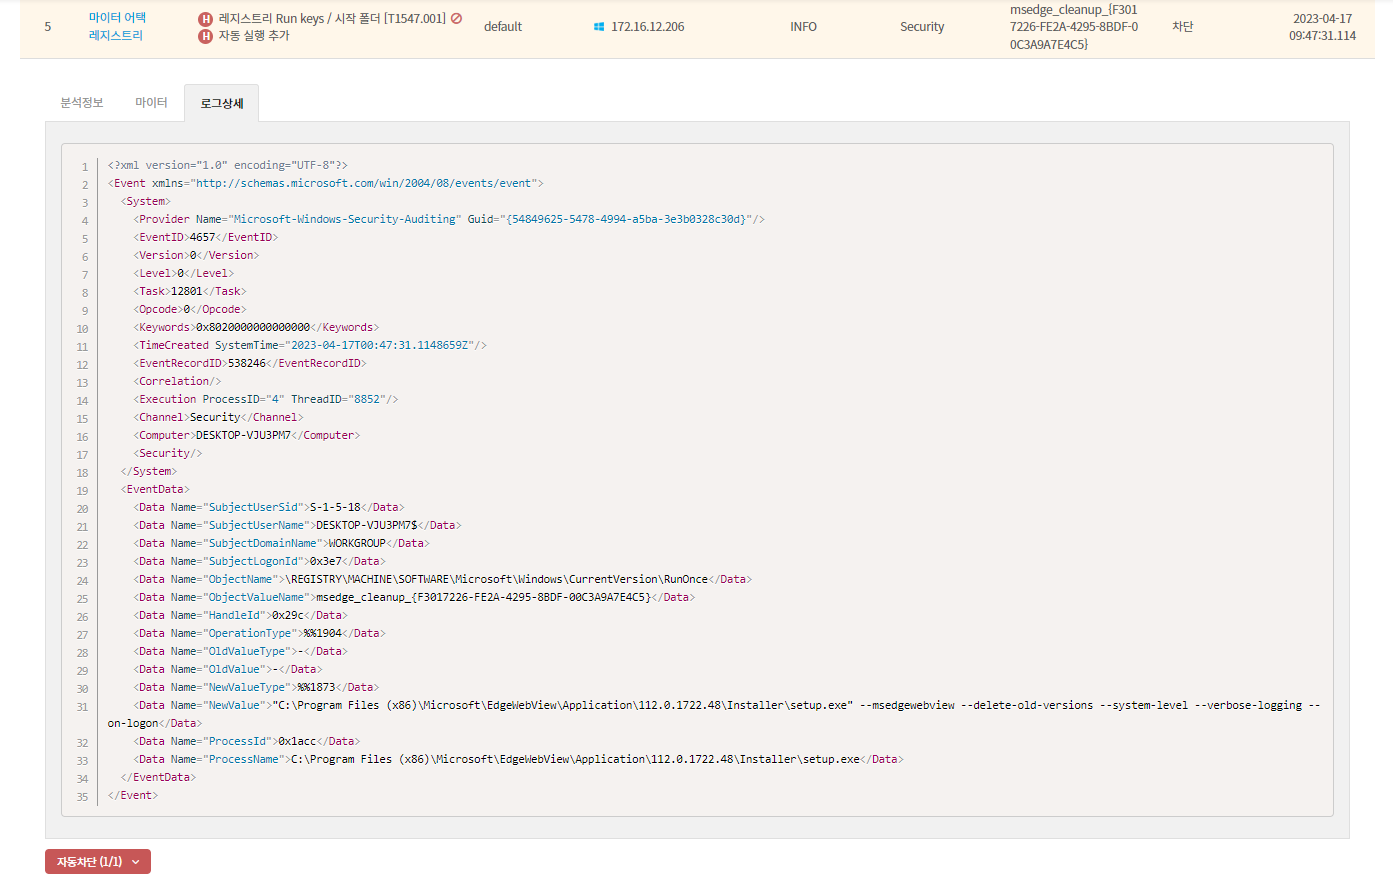
<figure><img src="/files/IS8aHuFHTtgR5Tl6jrvu" alt="" width="563"><figcaption></figcaption></figure>

### 2. 로그상세 원본 내용 <a href="#id-2" id="id-2"></a>

* ‘로그상세’ 버튼을 클릭하면 발생된 원본 내용을 확인할 수 있습니다.

<figure><img src="https://qubitsec.github.io/docs/images/Manual/edr/filter/hostsec/014.png" alt=""><figcaption></figcaption></figure>

### 3 . 전체로그 이동 우클릭 마우스 옵션 <a href="#id-3" id="id-3"></a>

* 로그별 컬럼에서 우측 마우스 버튼을 클릭하면 다음의 전체로그 페이지로 편리하게 이동

<table><thead><tr><th width="202">선택 조건</th><th>의미</th></tr></thead><tbody><tr><td>전체로그(=) </td><td> '동일' 시간대의 전체로그</td></tr><tr><td>전체로그(±1s)</td><td>'1초' 전후 시간대의 전체로그</td></tr><tr><td>전체로그(±2s)</td><td>'2초' 전후 시간대의 전체로그</td></tr><tr><td>전체로그(±3s) </td><td>'3초' 전후 시간대의 전체로그</td></tr><tr><td>전체로그(±5s) </td><td>'5초' 전후 시간대의 전체로그</td></tr><tr><td>전체로그(±10s) </td><td>'10초' 전후 시간대의 전체로그</td></tr><tr><td>전체로그(±30s) </td><td>'30초' 전후 시간대의 전체로그</td></tr><tr><td>전체로그(±60s) </td><td>'60초' 전후 시간대의 전체로그</td></tr></tbody></table>

* 티켓 발행
* IP주소 : IP주소 태그 입력 기능&#x20;
* 시스템 관리 : 선택한 호스트의 시스템 관리 페이지로 편리하게 이동

***

### 4. 날짜 정렬 <a href="#id-4" id="id-4"></a>

* 생성일 기준으로 최신순과 과거순으로 정렬할 수 있습니다.
* 기본 정렬은 최신순으로 마지막 생성된 로그가 표시됩니다.

<figure><img src="/files/NTaIqlV6DYTPiufqBJF1" alt="" width="563"><figcaption></figcaption></figure>

### 5. 한 페이지에서 보여 주는 로그 라인 수 <a href="#id-5" id="id-5"></a>

* 한 페이지당 보이는 로그의 수를 설정할 수 있으며 기본 20으로 100라인까지 선택가능합니다.

<figure><img src="/files/LjlYgdXP9xsEvSBOfgMZ" alt="" width="563"><figcaption></figcaption></figure>

### 6. 날짜/시간 선택 <a href="#id-6" id="id-6"></a>

* 기본은 오늘 발생 로그로, 시간 설정을 통하여 특정 로그를 검색할 수 있습니다.
* 기간을 확대하여 과거 1주 또는 1개월을 선택할 수 있습니다.

<figure><img src="/files/3mNqrSCXPKTNmT4mBWjj" alt="" width="563"><figcaption></figcaption></figure>

### 7. 그룹 선택 <a href="#id-7" id="id-7"></a>

* 사용자가 등록한 그룹을 선택해서 확인할 수 있습니다.

<figure><img src="/files/B3EoK54n2Ix551W4d3l0" alt="" width="563"><figcaption></figcaption></figure>

### 8. 운영체제 선택 <a href="#id-8" id="id-8"></a>

* 수집되는 로그를 운영체제 기준으로 분류할 수 있습니다.

<figure><img src="/files/6GxpQpm4WSeUF4ysZmc7" alt="" width="563"><figcaption></figcaption></figure>

### 9. 호스트명 선택 <a href="#id-9" id="id-9"></a>

* 호스트명을 선택해서 확인할 수 있습니다.&#x20;

<figure><img src="/files/7cYYYSufHQohv9hyPYFZ" alt="" width="563"><figcaption></figcaption></figure>

### 10. 호스트 선택 <a href="#id-10" id="id-10"></a>

* 특정 호스트를 선택해서 해당 로그만 확인할 수 있습니다.&#x20;

<figure><img src="/files/AWWn0s2Z2u2zHNiHiEyX" alt="" width="563"><figcaption></figcaption></figure>

### 11. 분류 선택 <a href="#id-11" id="id-11"></a>

* 분류별로 선택해서 확인할 수 있습니다.&#x20;

<figure><img src="/files/cvtdaGeqKjAzXS4HnUF0" alt="" width="563"><figcaption></figcaption></figure>

### 12. 위험도 선택 <a href="#id-12" id="id-12"></a>

* 위험도를 선택해서 확인할 수 있습니다.&#x20;

<figure><img src="/files/pLQrg3v7YmHzXIUwLHB0" alt="" width="563"><figcaption></figcaption></figure>

### 13. 심각도 선택 <a href="#id-13" id="id-13"></a>

* 심각도를 선택해서 확인할 수 있습니다.&#x20;

<figure><img src="/files/LyINVetXuVcmZfvaYPox" alt="" width="563"><figcaption></figcaption></figure>

### 14. 채널 선택 <a href="#id-14" id="id-14"></a>

* 채널 목록을 클릭하여 필요한 로그만 선택해서 확인할 수 있습니다.&#x20;

<figure><img src="/files/V0Vy4ZikZXabt3UOmN4c" alt="" width="563"><figcaption></figcaption></figure>

### 15. 유형 선택 <a href="#id-15" id="id-15"></a>

* 유형별 선택을 하여 필요한 로그만 선택해서 확인할 수 있습니다.&#x20;

<figure><img src="/files/VJi43qaw8OfZSIlRM8ch" alt="" width="563"><figcaption></figcaption></figure>


---

# Agent Instructions: Querying This Documentation

If you need additional information that is not directly available in this page, you can query the documentation dynamically by asking a question.

Perform an HTTP GET request on the current page URL with the `ask` query parameter:

```
GET https://docs.plura.io/ko/fn/edr/detection.md?ask=<question>
```

The question should be specific, self-contained, and written in natural language.
The response will contain a direct answer to the question and relevant excerpts and sources from the documentation.

Use this mechanism when the answer is not explicitly present in the current page, you need clarification or additional context, or you want to retrieve related documentation sections.
