# 호스트보안 분석

{% hint style="info" %}
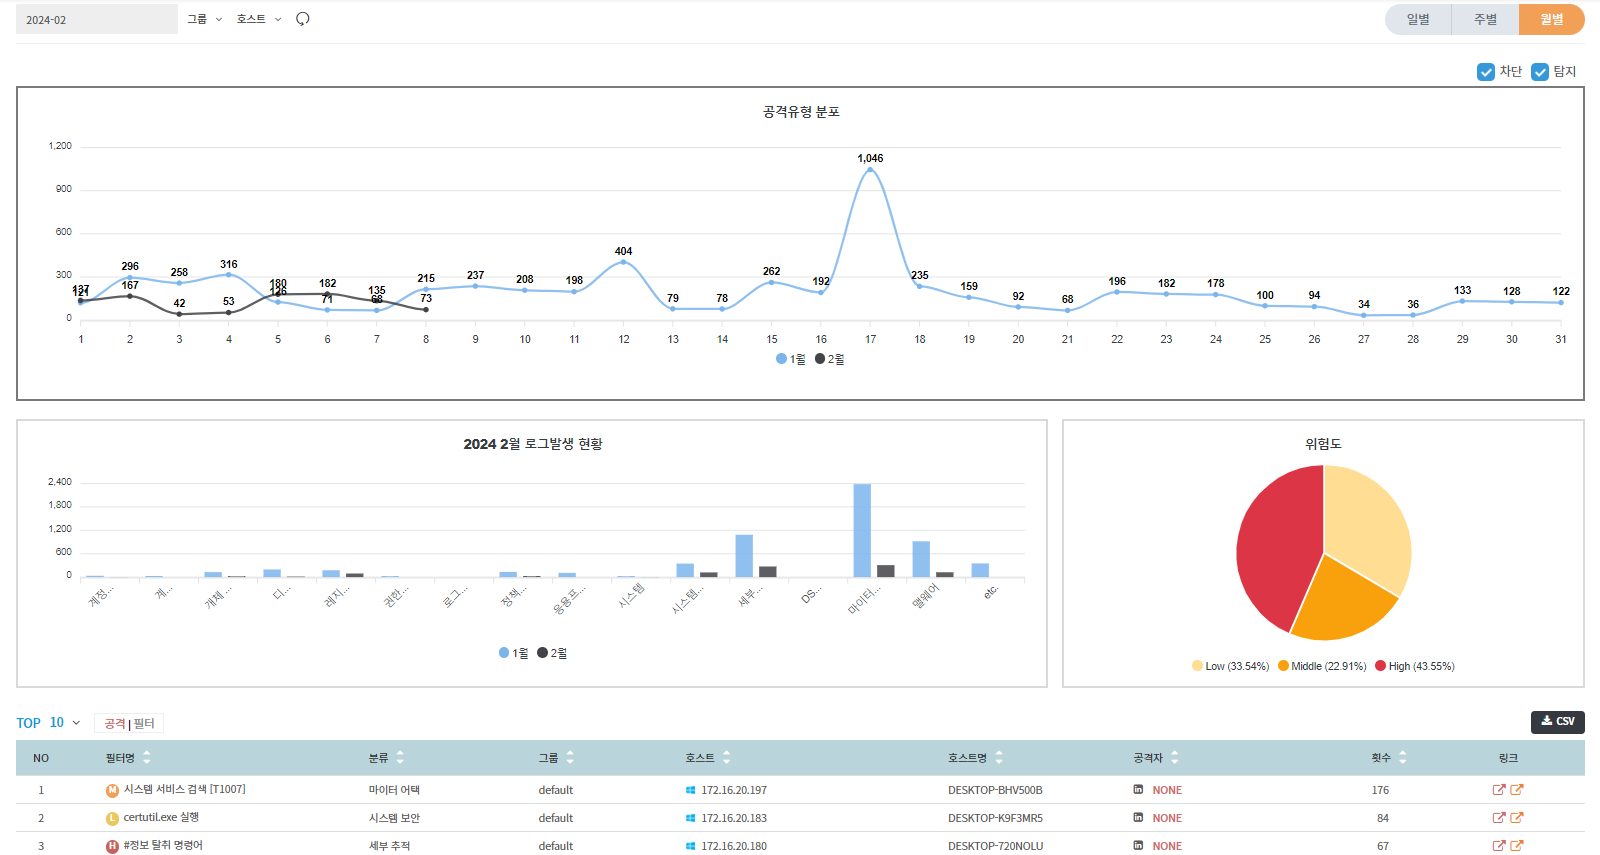
추천 및 사용자 정의 필터를 활용하여 탐지된 로그와 차단된 로그에 대한 가시성을 제공합니다.

* 그래프의 추세 변화를 통해 이상 징후를 탐지할 수 있습니다.
* 특정 호스트나 시간대를 빠르게 조회하여 이상 현상을 조사할 수 있습니다.
  {% endhint %}

### 보고서 항목 <a href="#id-1" id="id-1"></a>

* 일별 보고서&#x20;

<figure><img src="/files/CSFN4ov0qEqSoDb29PFO" alt=""><figcaption></figcaption></figure>

* 주별 보고서&#x20;

<figure><img src="/files/sN99uECb2NvPl6mW9AHu" alt=""><figcaption></figcaption></figure>

* 월별 보고서

<figure><img src="/files/fmW8Q7qvc0nFKDLHOhsH" alt=""><figcaption></figcaption></figure>


---

# Agent Instructions: Querying This Documentation

If you need additional information that is not directly available in this page, you can query the documentation dynamically by asking a question.

Perform an HTTP GET request on the current page URL with the `ask` query parameter:

```
GET https://docs.plura.io/ko/fn/comm/report/edr.md?ask=<question>
```

The question should be specific, self-contained, and written in natural language.
The response will contain a direct answer to the question and relevant excerpts and sources from the documentation.

Use this mechanism when the answer is not explicitly present in the current page, you need clarification or additional context, or you want to retrieve related documentation sections.